PPM Reports Interface: Overview
PPM Reports Interface: Overview
- The PPM Reports module in Wavity provides Project Managers, PMO leads, and other stakeholders with a centralized view of key project metrics, helping in efficient decision-making.
- Note: The steps provided serve as sample instructions and can be customized based on specific requirements; however, the core workflow will remain the same.
- Users can access various project reports from the left-hand side panel:
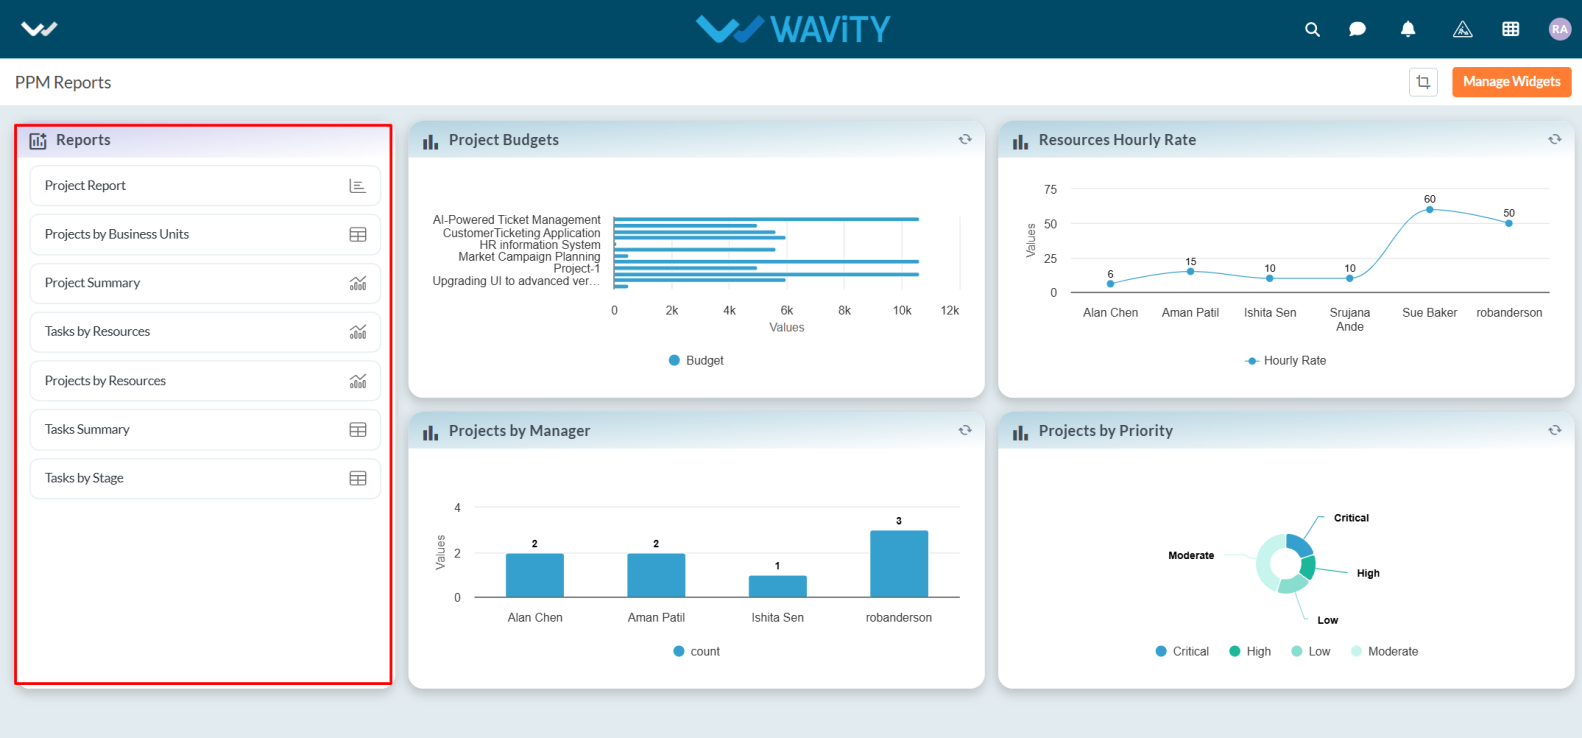
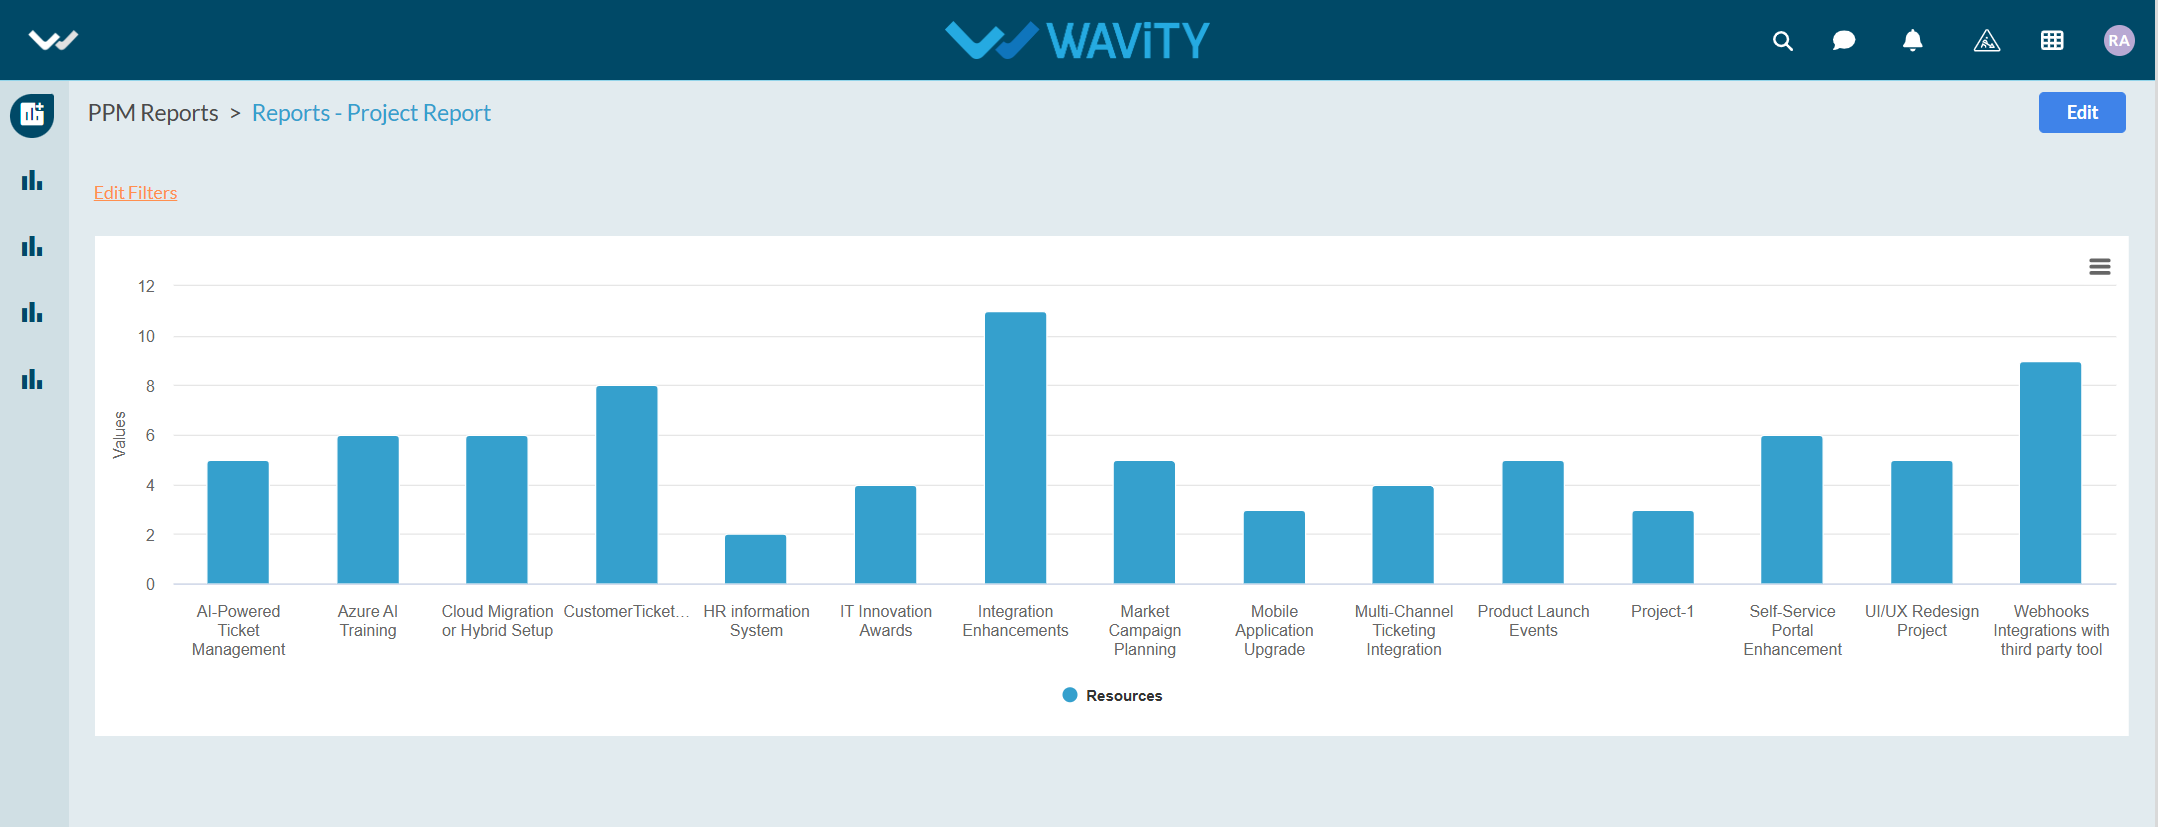
- Project Report – View detailed project information in column chart.
- Projects by Business Units – Filter and track projects under specific business units.
- Project Summary – Overview of all project-level insights.
- Tasks by Resources – Analyze how tasks are distributed across team members.
- Projects by Resources – See resource allocation across different projects.
- Tasks by Stage – Understand task progression across different project stages.
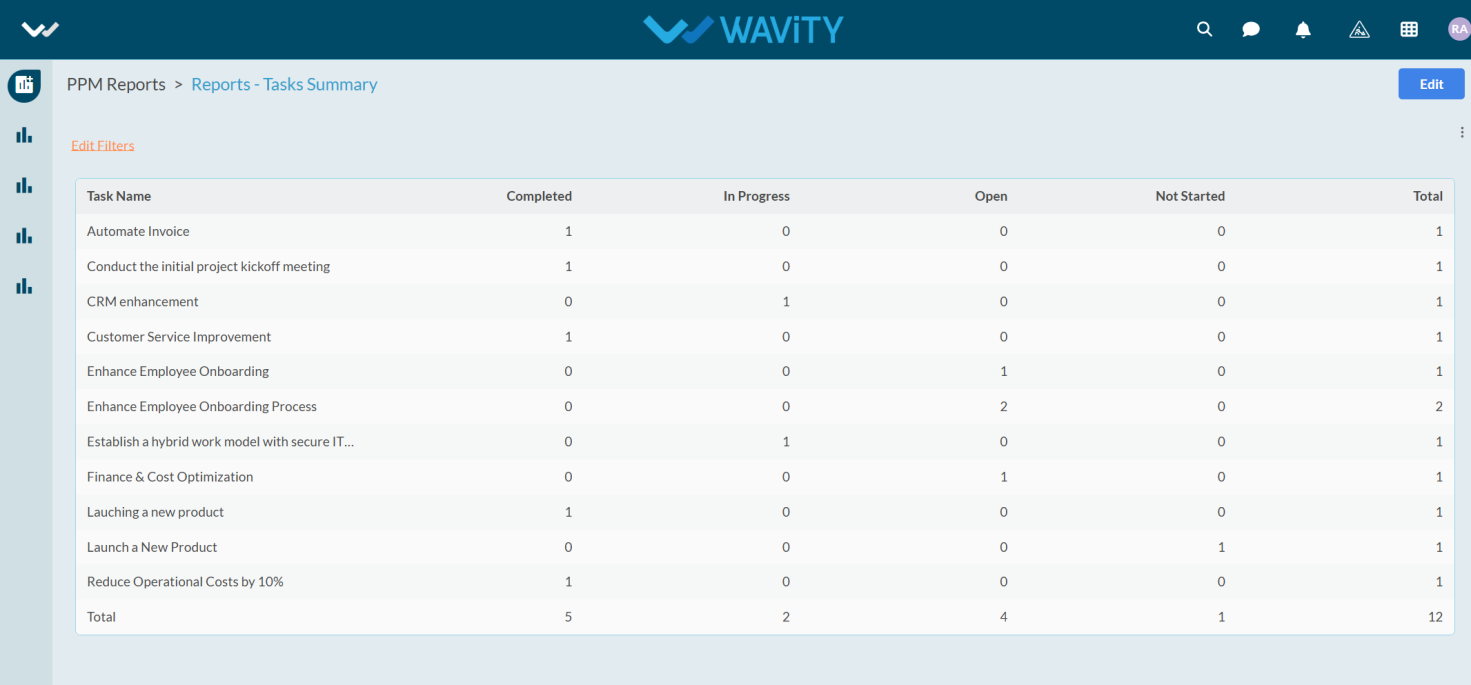
- Tasks Summary – Get a summarized view of all project tasks.
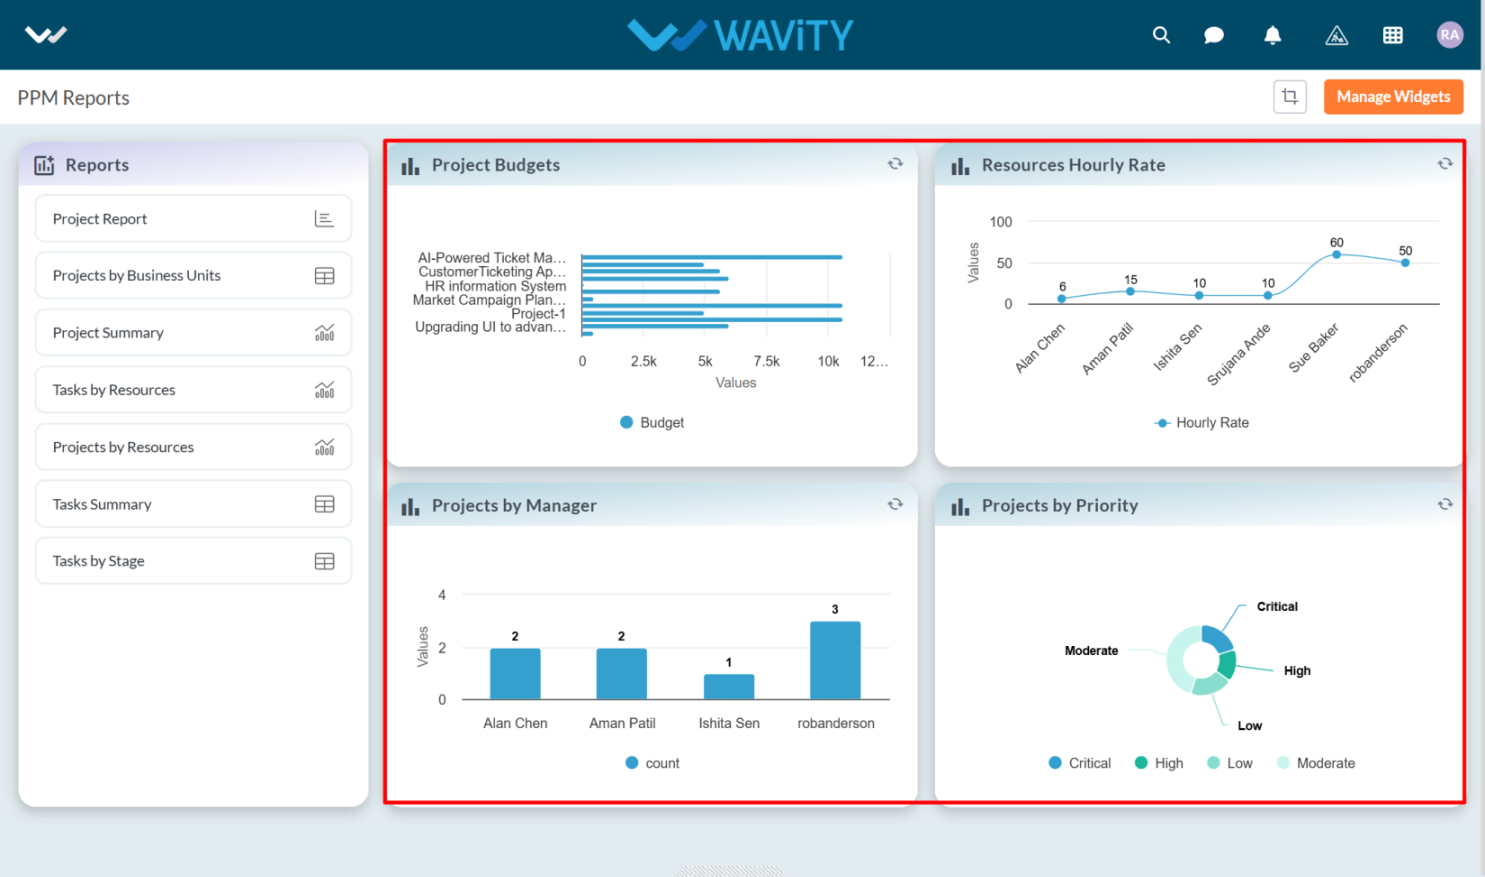
- Additional reports are available through the interface provided below.
- Project Budgets: Displays a bar chart representing the budgets allocated to each project. This visualization assists in comparing and tracking budget distribution across projects such as AI-Powered Ticket Management, HR Information System, Market Campaign Planning, and others.
- Resources Hourly Rate: A line chart illustrating the hourly rates of resources, supporting effective cost analysis and budget planning.
- Projects by Manager: Bar chart showing the number of projects handled by each manager.
- Projects by Priority: A donut chart categorizing projects by priority critical, high, moderate, and low helping PMOs and Leads prioritize effectively.